What is QEMU?
QEMU is an open source machine emulator/virtualizer. Most commonly it’s used for system emulation where it can provide a virtual model of an entire machine (CPU, memory, and emulated devices). For the purposes of this post we’ll be looking specifically at the ARM system emulator capabilities.
QEMU supports Cortex M0, M3, M4, and many many other chips. Each system that is supported matches a specific chip. For example, if you wanted a Cortex M0 emulator you could choose the “microbit” QEMU system which is based on the nRF51822 SoC. This emulator supports the ARMv6-M architecture and the Cortex M0 instruction set.
So based on whichever real hardware you are targeting you would need to find a QEMU system emulator that is the same as your target system or something that is as close as possible.
A list of all the ARM emulators can be found here: https://www.qemu.org/docs/master/system/target-arm.html
Why Use an Emulator?
Sometimes an emulator can be very handy to develop application code while you’re waiting for hardware to arrive. It can also be used to understand and play around with the Zephyr kernel (or others) without having to worry about how to properly initialize a board. It also could be used for cross-platform testing without hardware and/or to help debug some kernel issues.
How to Run my Code in QEMU
First, find a QEMU emulator that matches how you compiled your code. Again, for example, if you are compiling/targeting a Cortex M0 chip you must find a QEMU emulator that supports Cortex M0.
Some caveats:
How to Run and Debug a ARM Cortex M3 Binary Compiled by Zephyr
The rest of this post will explain how to run (and debug) a ARM Cortex M3 binary compiled by Zephyr. We will be using a specific Zephyr build that targets QEMU, but keep in mind that any Zephyr build can be used, you will just have to account for the clock control startup code.
Setting up Zephyr and VSCode on your System:
The following steps will set up a copy of a Zephyr sample program on your computer. We could use Nordic’s tools to create a project, but for the sake of portability we’ll do it on the command line.
1. Follow these steps exactly (Down to “Flash the Sample” – stop before doing that): https://docs.zephyrproject.org/latest/develop/getting_started/index.html
- This will install cmake, ninja, python3, QEMU, etc.
- It’s very important to use a python virtual environment as the above link discusses. This was a bit confusing, but essentially what you want to have is all the Zephyr build tools (West and Zephyr SDK) inside the python virtual machine. If you don’t, you’ll possibly run into conflicts with what’s in there and what’s used by the system tools in your path.
2. Install VSCode and the following extensions (if not already installed)
- VSCode
- Cortex-Debug
This gives support for debugging (which we will setup later) This also installs “debug-tracker-vscode”, “MemoryView”, “PeripheralViewer”, and “RTOS Views”. - Python Extension Pack – For running a python virtual machine in VSCode on the terminal.
- CMake
- C/C++ Extension Pack
3. Create an empty folder that will contain our project inside of the Python Virtual environment you created in Step #1. For example, my virtual environment is located at:
/Users/lee/zephyrproject
That is, the .venv file is located inside this folder. This is a hidden file so you can double check where your virtual environment is by doing a:
ls -la
Command in a terminal if running on MacOS or Linux and looking for the .venv file.
After finding this location, create a new folder there to store a project. Mine looks like
/Users/lee/zephyrproject/TestApp
where TestApp is the new folder I created.
4. Point VSCode to the python virtual environment. This will make each terminal opened in VSCode open in the virtual environment. This is useful so that we can run the command:
west build
from the terminal since we haven’t installed the Nordic Zephyr extensions, nor is west on the path.
- Open the folder created in Step #3 in VSCode. File->Open Folder
- Go to the “Show and Run Commands” (Click the search bar at the top of VSCode). Type in “Python: Select Interpreter”. Click on that and then it will prompt you to give it the location of the python interpreter. We want this to be the python virtual environment.

-
Type in the path to your virtual environment. For example mine is:
/Users/lee/zephyrproject/.venv/bin/python
Make sure to type in the path manually as browsing to select the interpreter doesn’t work!
You can verify the correct interpreter is selected by running the “Python: Select Interpreter” command again. After that is set up, now, when you open a terminal window in VSCode it should open in the virtual environment.
You can open a new terminal in VSCode and check this by looking for a .venv in the terminal prompt line. See image below for example:

5. Create a minimal Zephyr Project from scratch. For this step we’ll use the Zephyr Synchronization demo as a template. This can be found where you installed Zephyr in the relative location:
…/zephyr/samples/synchronization/
Copy src/main.c from that folder to a src folder inside the project folder made in step #3. Also copy the prj.conf file from that folder into our project folder.
- Create a new CMakeLists.txt file in our project folder with the following contents:

- That’s it! You should have CMakeLists.txt, main.c, and prj.conf files in a file structure that looks like:
TestApp
├── CMakeLists.txt
├── prj.conf
└── src
└── main.c - See https://docs.zephyrproject.org/latest/develop/application/index.html#application for additional information about the project file structure.
6. Build the application. Build it by opening a terminal in VSCode (needs to be the virtual environment terminal). Run:
west build -b qemu_cortex_m3
This will build an .elf file that can be run on QEMU. Notice that we’re using a board called “qemu_cortex_m3”. This is a specific Zephyr build that is tailored for QEMU and doesn’t have any clock setup that would cause infinite loops otherwise.
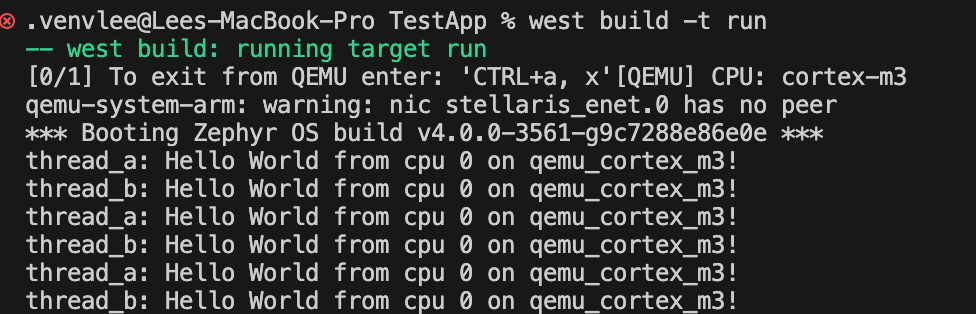
7. Running on QEMU. In the VSCode terminal type:
west build -t run
Note: You can also use ninja run from the build folder. You should see the program running now!
8. The above is relatively un-interesting as all we’re doing is running some code on an emulator. More interestingly, we can set up a gdb debugger and use VSCode to visually be able to step through line-by-line and look at registers.
In addition, it should be mentioned that by replacing “qemu_cortex_m3” with any other board will build an .elf file for that specific board. Other non-qemu builds can still be run on QEMU, but your mileage may vary depending on how many peripherals it has that QEMU doesn’t support, and whether or not a clock tree is supported.
Also, to use a new board run:
west build -t pristine
to clean up your build folder and be able to specify a new board target.
So….now let’s look at how we can set up a debugger in VSCode which can be used for QEMU, JLink, STLink, openocd, and many others!
Setting up GDB in VSCode
GDB (GNU Debugger) is a debugger that can be used for many different languages. In this case, we will be using it to set up a visual debugger in VSCode.
We will be using the same project we just ran on QEMU above. Make sure that it is set up and working properly before continuing with these steps. Most important is to have the “Cortex-Debug” extension installed.
Cortex-Debug
This is an extension for Visual Studio code that integrates with its built-in debugger to allow step by step debugging with an emulator, a J-Link, an ST-link, or many others. All we need to do is to create or add to a launch.json file. This file must be in the .vscode folder. Once this file is created there will be an option under “Run and Debug” to start debugging.


With an empty launch.json file, clicking on the Debug Cortex M3 on the right won’t do anything.
Let’s walk through configuring a launch.json setup for our QEMU application binary. The following is a screenshot of the launch.json we’ll be walking through.

- armToolchainPath: This should be the path where the arm compiler, linker, and debugger (gdb) lives at. Note that we are using the one that zephyr provides. You can also download the “arm-none-eabi” package or any other arm compiler and use that instead. This line isn’t required if the arm binaries are on your Path.
- name: Name of the Debug Configuration (can be anything you want)
- type: Must be “cortex-debug” as this is the type of debugger to be used for the launch configuration.
- request: Should be “launch” to start the debugger. The other option is “attach”.
- machine: This is only required when the “servertype” is “qemu”. This indicates to qemu what kind of emulated machine to start up to run the compiled ARM binary on. The lm3s6965evb is a specific Cortex M3 system that QEMU provides. You can look here for different machines available: https://www.qemu.org/docs/master/system/target-arm.html
- executable: Full path and name of ARM binary to run on qemu. This should be what you compiled with west build in the first section.
- cwd: Directory of where to run the debug commands in. Recommend leaving as the working directory.
- servertype: “qemu” = Start up the qemu machine. Normally for real debugging you would use “jlink” for real hardware and then configure the settings here. QEMU provides a gdb server and the result of this is that Cortex-Debug will start it up for us with the arguments of “-gdb TCP::5000” which creates a gdb server at TCP port 5000. Cortex-Debug will then connect to that server for us with the gdb program it finds on the armToolchainPath.
- breakAfterReset: This is an important one as setting to true will break on the first instruction and halt the debugger. 95% of the time this is likely what you want. For QEMU this inserts the -S instruction to “qemu-system-arm” which tells it to halt the CPU at start up.
- showDevDebugOutput: Prints all GDB responses to the console. Can be raw, parsed, or both. Removing it will remove the dev debug output. This is NOT necessary to have to debug.
- toolchainPrefix: Also very important as it allows you to override the default prefix of “arm-none-eabi”. Since we’re using the zephyr arm binaries we need to change this to “arm-zephyr-eabi” so that the debugger will use “arm-zephyr-eabi-gdb”, “arm-zephyr-eabi-nm”, and so on. If you’re using the arm-none-eabi binaries then you don’t need this line.
There are a large number of other configurations which allow you to configure hardware debugging with J-Link (out of the scope of this discussion). The steps to do so are laid out here: https://kb.segger.com/J-Link_Visual_Studio_Code
The above attributes are all explained in detail here at the Cortex-Debug github site: https://github.com/Marus/cortex-debug/blob/master/debug_attributes.md
Running Cortex-Debug
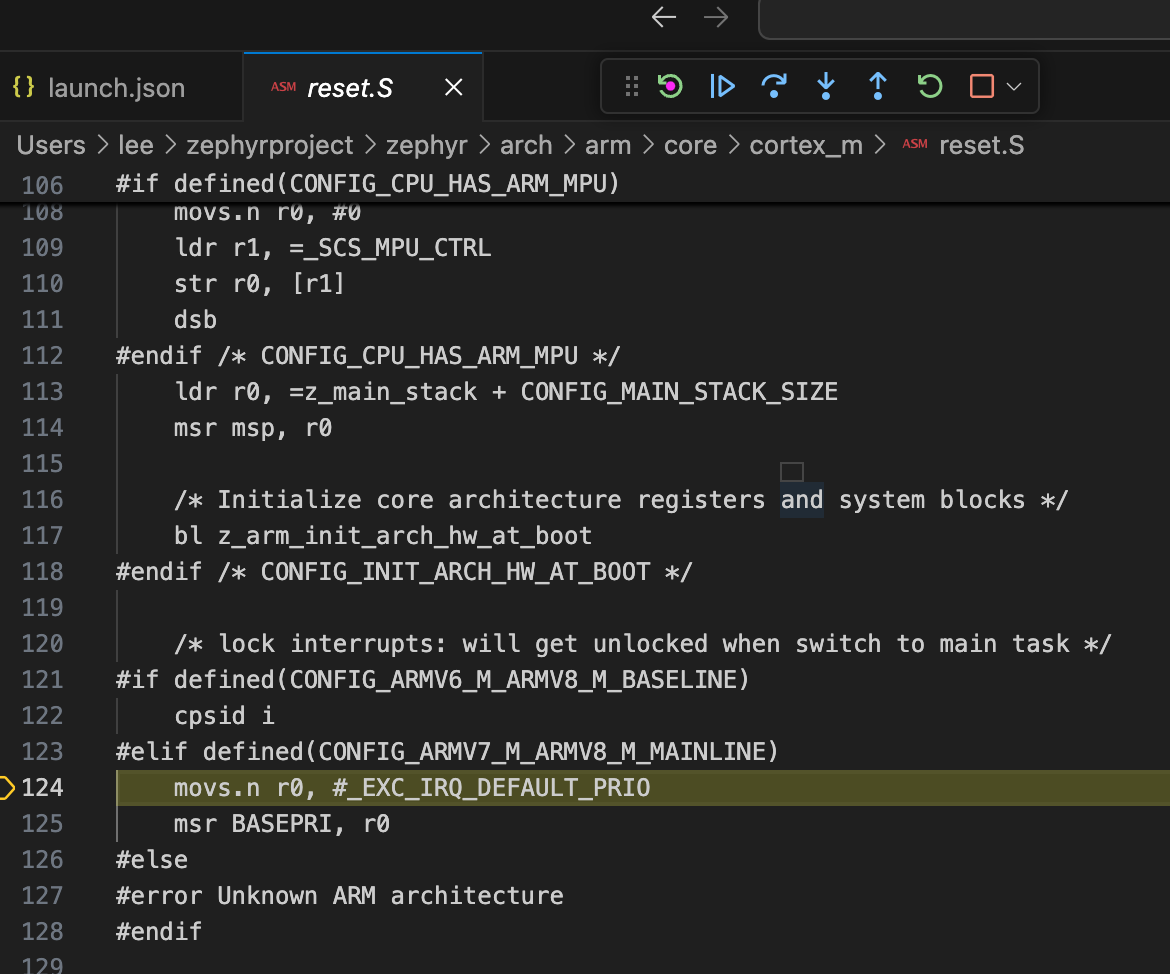
With the launch.json file configured, we’re ready to start debugging. Navigate to the Run and Debug icon on the left in VSCode and click on the run arrow by “Debug Cortex M3”.
Note: The first time you attempt to start a debug session, you might not see a run arrow, rather a Run and Debug button. Press that and then the run arrow with “Debug Cortex M3” should appear.
This will start the debugger and break in the reset.s file. It also opens up a “gdb-server” terminal as well as the “Debug Console”. On the top there should be a small bar with buttons to step in, step out, run, stop, etc. See the images below:

Debug Console Window and Output

Gdb-server terminal window
As shown above, the gdb-server terminal window will output the console printfs. The main.c program has two threads and constantly prints out to the screen.
The Debug Console can also be used to send command-line gdb commands.
Setting Breakpoints and Disassembly
Breakpoints can be set by clicking on the left-hand side of a source code file. The assembly code can be stepped through and viewed by right clicking in a .c code file and selecting “Open Disassembly” view (breakpoints can also be set here). See images below for breakpoint and disassembly view:

Disassembly View

Breakpoints in Red on the left-hand side
Memory View and RTOS View
The memory can be viewed by going to the “Memory” tab on the bottom of VSCode while the debugger is running. You have to click on the + symbol to add a new memory view (otherwise it won’t show any meaningful information).

Memory View
The RTOS view can be found under the “XRTOS” tab. This feature is not available when qemu is selected unfortunately. If using real hardware all you need to do is add the “rtos” attribute to the launch.json file and the XRTOS tab should begin working.
Variables, Registers, and Call Stack
Variables and Registers are shown on the left hand pane of VSCode when the debugger is stopped at a breakpoint. The registers shown are only r0-r12, sp, pc, lr, and a few other ones. To add the actual registers, see the section on “Xperipherals”


XPeripherals
This is the last section on debugging and will give an overview of how to get all the ARM registers for a specific chip to show up and be able to see and edit them.
The XPeripherals window is on the left-hand side of VSCode and only works when you have an “SVD” file configured in the launch.json.
An SVD file describes the peripherals of a microcontroller. CMSIS and many of the board manufacturers provide thousands of different ones which you can download. Note: There are also extensions for Cortex-Debug called “Cortex-Debug: Device Support Pack” that contain SVD files for different processor families.
Unfortunately, for the QEMU machine being used for this example (lm3s6965evb), there isn’t a corresponding SVD file that exists. For the sake of an example here is what it looks like in launch.json with a STM32f100 svd file (still a Cortex M3 at least so it somewhat works).
When doing this on a different microcontroller you just need to find the correct SVD file which corresponds to it, download it, and enter its file path in “svdPath”.


Final Thoughts
The VSCode integration with the GDB server can be very useful when you want to debug something that you don’t have a nice IDE for. Certainly if you had IAR or STM32Cube just for example, the debugging there would probably be a little nicer than in VSCode.
However, sometimes projects need to be built IDE neutral and in that case using VSCode for development and debugging can be quite handy.
If you’d like to work with a knowledgeable team with engineers like me on your next embedded project, you can fill out our Contact form and we can get the conversation started.